The 20-year spot on the Bloomberg Valuation (BVAL) AAA Municipal yield curve yielded 3.91% as of January 30th, 2026. Yields at the 20-year spot on the Municipal curve have only been higher than today 7% of the time over the last 15 years!1
Furthermore, the difference between yields at the 20-year spot on the curve and yields at the 15-year spot on the curve – otherwise known as “steepness” –are at historically high levels. In fact, there has not been a single instance in the last 15 years where the steepness between the 20- and 15-year part of the curve has been this great.2
Higher yields (income) and steep rolldown potential translates to what we call a “head start” for a 20-year Municipal bond. This “head start” doesn’t just mean more attractive return potential – it makes bonds more defensive if rates rise, too. Let’s prove this.
There are a couple of facts we know:
- ▪The 10-year spot on the BVAL AAA is yielding 2.60%. If held to maturity, the bond will return 26.00% over the 10-year time period, ignoring compounding (2.6% x 10 years).
- ▪The 20-year spot on the BVAL AAA is yielding 3.91%. If held to maturity, the bond will return 78.20%. over the 20-year time period, ignoring compounding (3.91% x 20 years).
- ▪After the next ten years have passed, a 20-year Municipal bond will only have 10 years of life remaining. In other words, in ten years’ time, a 20-year Municipal bond will be a 10-year Municipal bond.
Given this information, we can calculate the future cash flows to determine how much Municipal rates would have to rise for the 20-year Municipal bond to “tie” the 10-year Municipal bond.
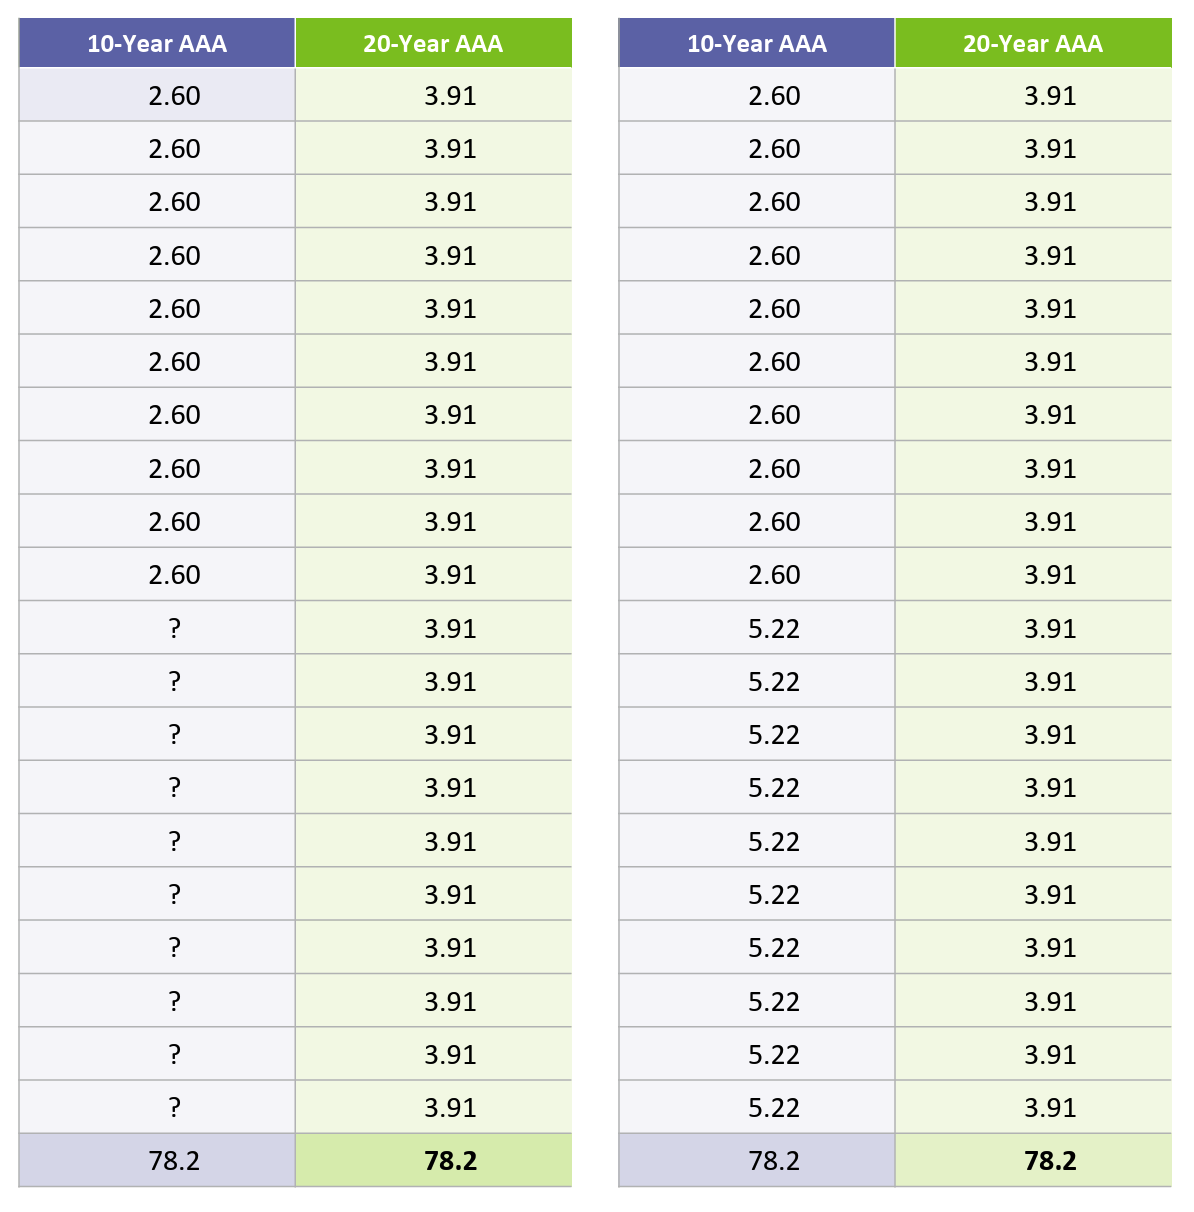
Table 1 (left): Knowing the 20-year Municipal bond will provide a 78.2% return over the next twenty years, we can calculate the breakeven return between the 20-year Municipal bond and the 10-year Municipal bond over the next twenty years. The 10-year Municipal bond needs an additional 52.2% of return to make up over the ten-year time period following its maturity (78.2% – (2.60% yield x 10 years to maturity, or 26% = 52.2%).
Put another way, at the maturity of the 10-year Municipal bond, if we reinvested our proceeds into another 10-year Municipal bond, it would have to provide a 10-year total return of 52.2% to breakeven with the returns of the 20-year Municipal bond (ignoring compounding).
Table 2 (right): We can calculate this! The new 10-Year Municipal bond would have to yield 5.22% (52.2% needed returns / 10 years to maturity) to tie the returns of the 20-year Municipal bond over our twenty-year horizon.
Municipal rates would need to rise 262 basis points for the 10-year Municipal bond to tie our 20-year Municipal bond!
We make investment decisions through the lens of Shape Management, which implements yield (income) and yield curve roll considerations (among others). It also utilizes a 3-year horizon, a likely improvement in the investment decision process, when compared to the 20-year horizon required in our break-even analysis. Here’s what the 20-year and 10-year bonds look like through Shape Management.
Three-year horizon total return analysis (Illustrative performance)
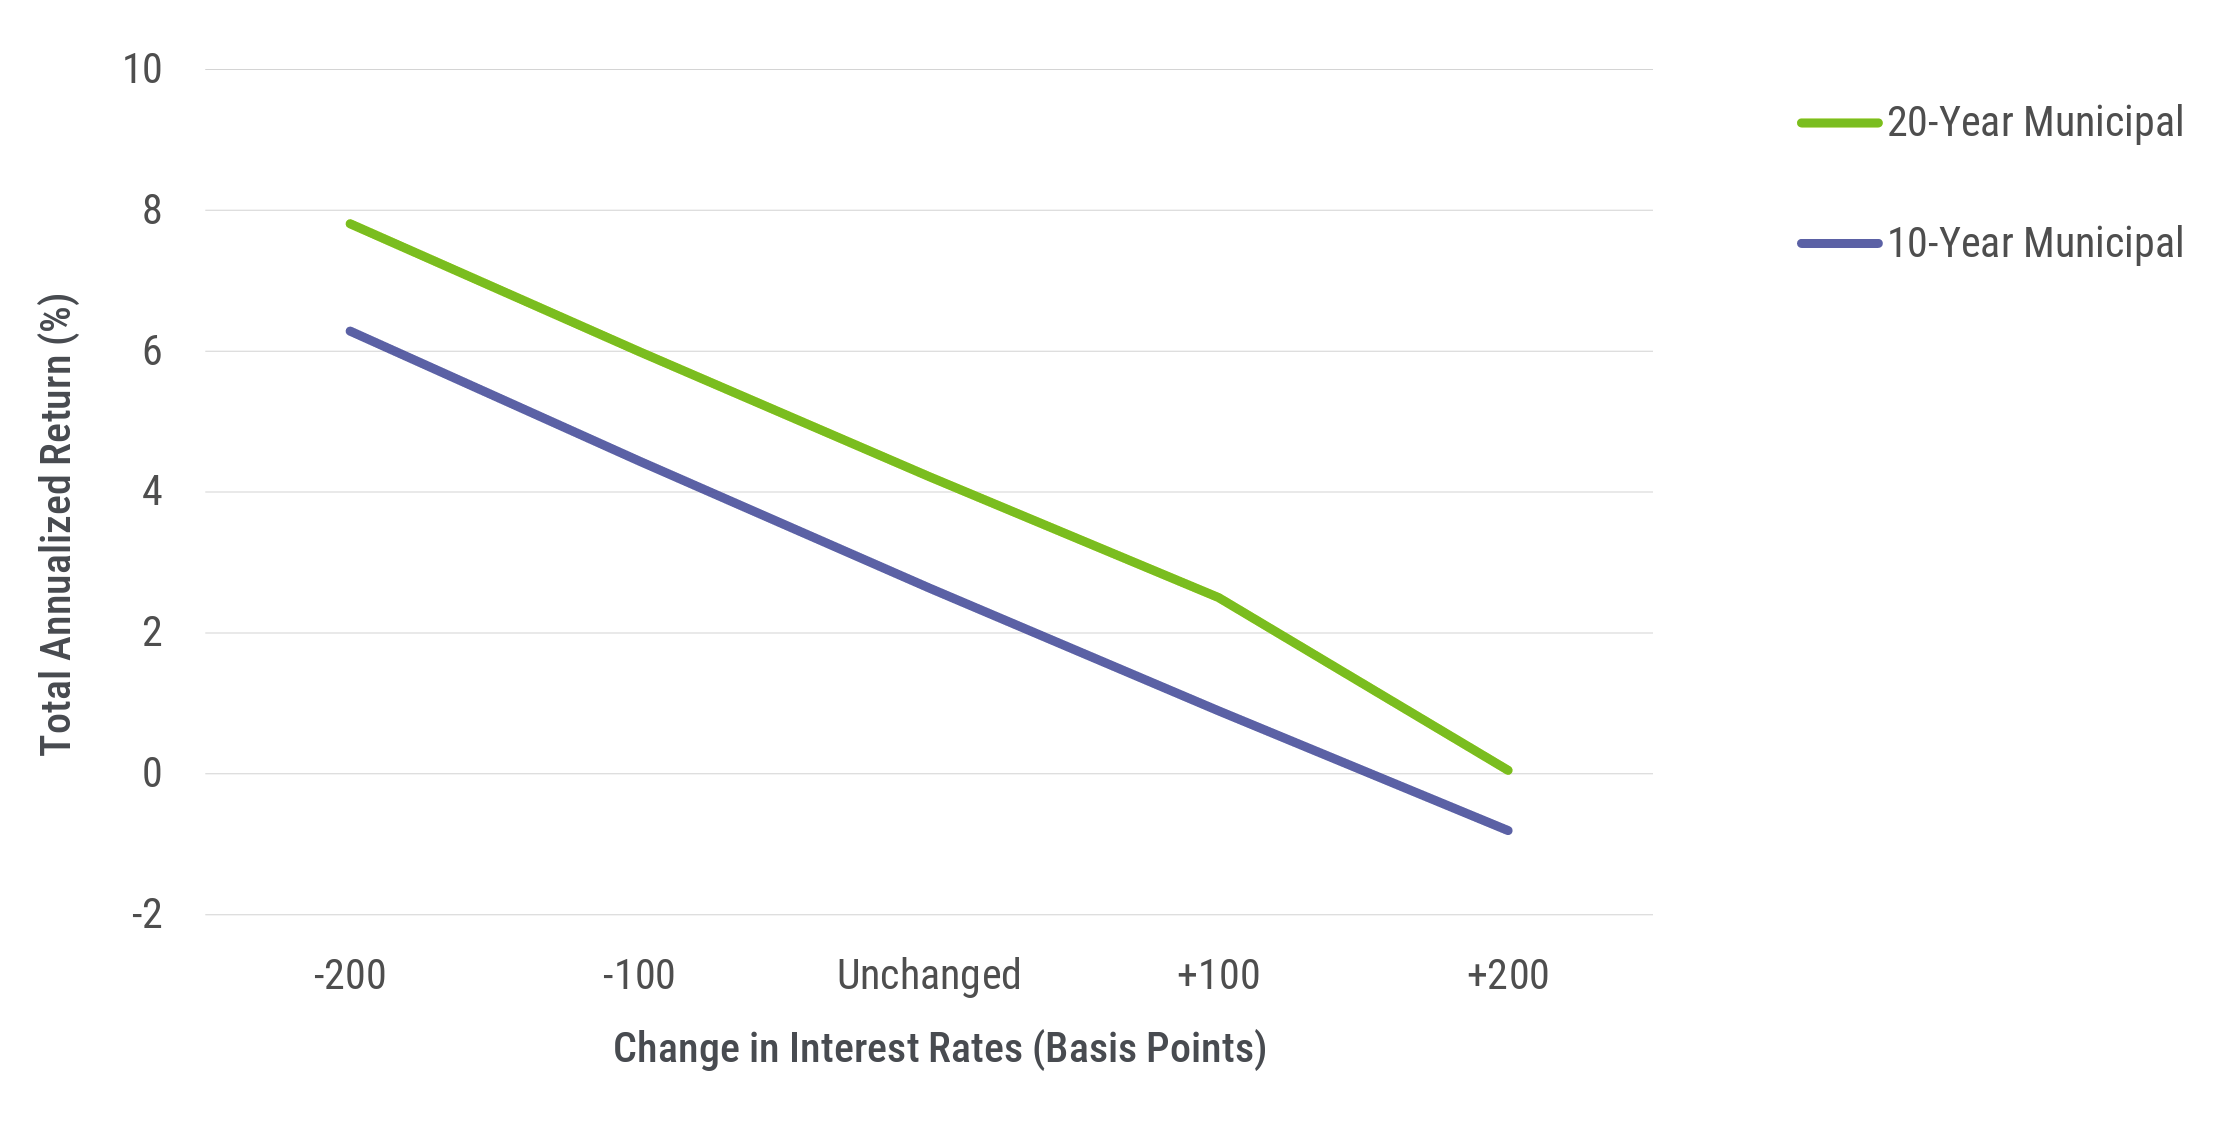
Sources: PTAM, Bloomberg as of 1/30/2026. The following bonds that are used to create the Shapes are held by PTAM clients as of the date of this distribution: 20-year AAA-rated Taxable Muni. The10-year and20-year, AAA-rated Taxable Muni Shape were generated with 1 bond currently held by PTAM and fitting the criteria stated.
Assumptions: (1) a parallel shift in the yield curve (2) static allocation for 3 years (3) linear rate changes (4) sector specific spreads are held constant across five rate scenarios (5) reinvestment rate consistent with respective sector.
There’s a reason I can’t stop talking about Municipal bonds. The opportunity present at and around the 20-year spot of the Municipal yield curve is one rarely witnessed in recent history. When empowered by Shape Management, we do not need to know where interest rates will go in order toknow which bond will generate more dollars of total wealth (total return) over time. We can’t wait to see how go-forward returns –both absolute and relative “Shape” out!
1 Source: Bloomberg. Data as of 1/30/2011-1/30/2026.
2 Source: Bloomberg. Data as of 1/31/2011-1/30/2026.
Financial professionals only. Not for public distribution.

Taylor acts as PTAM’s Client Portfolio Manager, serving as a liaison between investments, marketing, and sales. She is responsible for investment strategy updates and portfolio communications for all PTAM’s products. Taylor additionally leads production of various portfolio and market commentary as well as dedicated strategy content. Taylor received a Bachelor of Arts from the Princeton School of Public and International Affairs from Princeton University. She is also a CFA® charter holder.
GLOSSARY
Yield Curve refers to the U.S. Treasury yield curve rates.
RISKS AND OTHER IMPORTANT CONSIDERATIONS
Investing involves risk; principal loss is possible. Investments in debt securities typically decrease in value when interestrates rise. This risk is usually greater for longer-term debt securities. Investments in lower rated and non-rated securities present a greater risk of loss to principaland interest than higher-rated securities. Investments in asset-backed and mortgage-backed securities include risks that investors should be aware of such as credit risk, prepayment risk, possible illiquidity and default, as well as increased susceptibility to adverse economic developments. For a complete list of disclosures, please visit www.ptam.com.
When selecting a bond to invest in, most investors rely on what we refer to as “traditional fixed income metrics,” which are generally a combination of (1) taking a stance on whether interest rates will increase or decrease, (2) yield and (3) duration. Nearly 30 years ago, PTAM’s founders recognized the potential shortcomings in traditional bond metrics, and developed Shape Management, a math-based investment process that addresses each ofthese shortcomings by analyzing the risk return profile of a bond’s future cash flows. Shape Management is a mathematical calculation that analyzesthe risk return profile of a bond’sor group of bonds’ future cash flows. By using Shape Management, PTAM creates projections of the performance of specific bonds or grouping of bonds. These projections are not the actual performance of any bond or product. As a result, Shape Management performance in this email were not actually achieved by any PTAM investment or product. The criteria and assumptions underlying the projected performance may prove to beincorrect. Prospective investors should not rely solely on such projected performance and should conduct a thorough independent analysis of the investment opportunity. The graphs included throughout this email are provided for illustrative and educational purposes only. Projected performance results mayhave many inherent limitations. No representation is being made that an investment will, or is likely to, achieve profits or losses similar tothose shown. In fact, there are frequently significant differences between projected performance results and actual results subsequently achieved. Although projected performance may be useful to consider when making an investment decision. Investment decisions based on Shape Management information may not be profitable. All projected performance is shown as net performance, which includes management fees, reinvestment of interest payments, principal payments, and capital gains.
The information included is not an offer, recommendation or professional advice. Certain information contained herein has been obtained from third party sources and such information has not been independently verified by PT Asset Management, LLC. No representation, warranty, orundertaking, expressed or implied, is given to the accuracy or completeness of such information by PT Asset Management, LLC or any other person. While such sources are believed to be reliable, PT Asset Management, LLC does not assume any responsibility for the accuracy or completeness of such information. PT Asset Management, LLC does not undertake any obligation to update the information contained herein as of any future date. This email is confidential, is intended only for the person to whom it has been directly provided and under no circumstances may a copy be shown, copied, transmitted or otherwise be given to any person other than the authorized recipient without the prior written consent of PT Asset Management, LLC. Any indices and other financial benchmarks shown are provided for illustrative purposes only, are unmanaged, reflect reinvestment of income and dividends and do not reflect the impact of advisory fees. Investors cannot invest directly in an index. Comparisons to indexes have limitations because indexes have volatility and other material characteristicsthat may differ from a particular hedge fund. For example, a hedge fund may typically hold substantially fewer securities than are contained in an index. Certain information contained herein constitutes “forward-looking statements,” which can be identified by the use offorward-looking terminology such as “may,” “will,” “should,” “expect,” “anticipate,” “project,” “estimate,” “intend,” “continue,” or “believe,” or the negatives thereof or other variations thereon or comparable terminology. Due to various risks and uncertainties, actual events, results or actual performance may differ materially from those reflected or contemplated in such forward-looking statements. Nothing contained herein may be relied upon as a guarantee, promise, assurance or a representation as to the future.
© 2025 PT Asset Management,