As bond funds across the country look to their YTD returns, many Core-Plus funds have found that markets were quite kind to them in 2025. Now, for investors who’ve followed Shape Management for years, we know that short term performance is not the true test of any fund manager. However, in a year where our core-plus bond strategy has underperformed its peer group and Index as of month end, one might be tempted to question our methodology. Why did we underperform this year? More importantly, knowing what we know now, would we have changed our methodology? Why, or why not? Let’s look back in time, and see what happened.
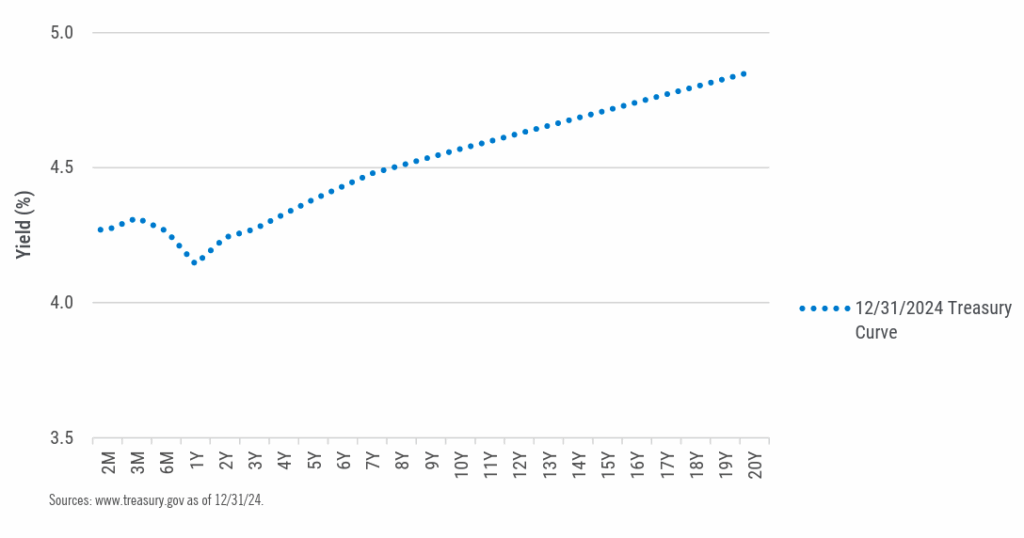
One year ago, the Treasury curve was higher, and slightly less steep than at the start of this month.
Visual 1 – 12.31.24 Treasury Curve
Where were we invested?
In 2024, our Shape Management analysis led us to the belief that a barbell approach would provide our strategies with the highest chance of outperformance over a 3-year horizon. This is why we chose to allocate ourselves along the “wings” of benchmark yield curves, rather than the belly.
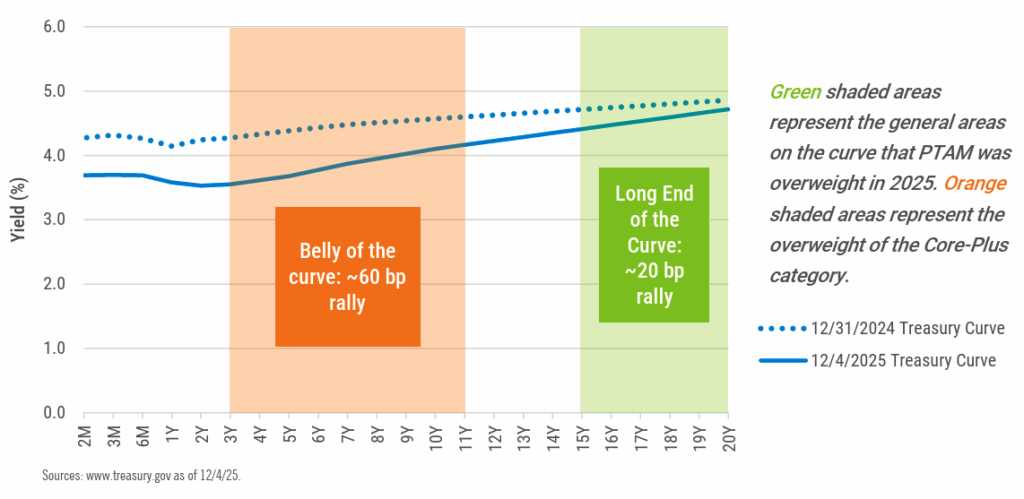
In 2025, Core-Plus bond returns were primarily driven by a non-parallel rally in interest rates. If you look at how the Treasury curve moved over the year (Visual 2), you’ll see that rates fell across the board. However, the belly of the curve fell by the greatest amount (about 60 basis points lower) as opposed to rates at the long end of the curve (about 22 basis points lower). Because the Core-Plus Category owned a significant amount of assets within the belly of the curve, and because our fund focused on investing in the wings, the move from 2024 to 2025 was kinder to a typical Core-Plus fund.
Visual 2 –12.31.24 vs. 12.4.25 Treasury Curve
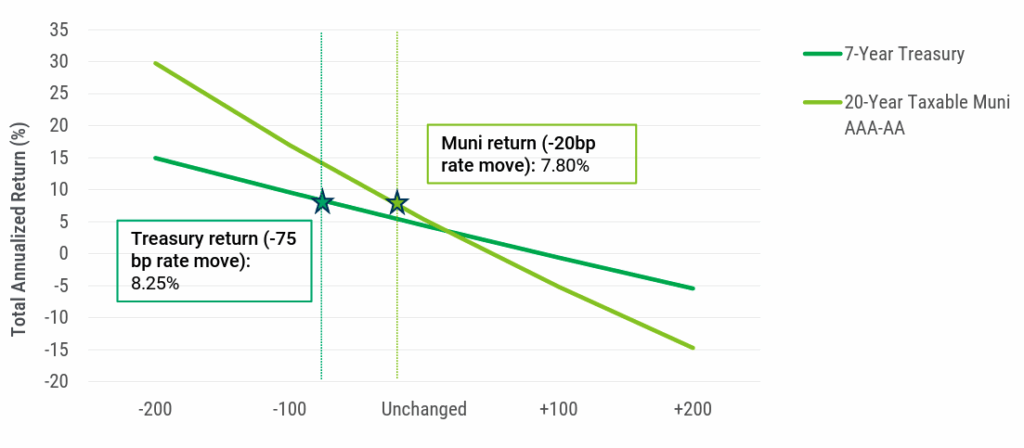
To help visualize the impact of this move on our investments, let’s do a look back on the returns of two assets. Given the Index was overweight to the belly of the curve, we’ll use a 7-Year Treasury as a reasonable proxy. We’ll compare this proxy to a 20-Year Taxable Muni (a pillar of our 2025 strategy). When we observe these two bonds’ YTD returns in 2025 (stars), given their YTD interest rate movement (dotted lines), their YTD returns match the values we had projected in our Shape Analysis at the end of 2024 (Visual 3). The 7-Year Treasury, due to the hefty rally in interest rates, outperformed our longer Taxable Muni by about 45 basis points (bps), a similar margin of victory to the outperformance of the Core-Plus category.
Visual 3 – Total Return Analysis
One-year horizon total return analysis (Illustrative performance)
Sources: PTAM, Bloomberg as of 12/31/24. The following bonds that are used to create the Shapes are held by PTAM clients as of the date of this distribution: 20-year Taxable Muni AAA-AA. To create the 20yr Taxable Muni AAA-AA, we take a subset of portfolio holdings that fall into specific asset class, duration, and structural buckets (coupon, cash flow volatility), and create an average total return shape for that sector. These shapes represent the fixed income logic and mathematics we apply to sectors both within our portfolio, AND in the market, with the appropriate fixed income characteristics. We have generated the 7-year Treasury shape since it represents one of the largest sectors of the Core-Plus category and the Bloomberg US Aggregate Bond Index. Our broad description of 7-Year treasuries would include any US Treasuries that have tenors between 68.5 years. “Muni return” and “Treasury return” were generated with a single CUSIP of the aggregate of Shapes.
Assumptions: (1) a parallel shift in the yield curve (2) static allocation for 1 year (3) linear rate changes (4) sector specific spreads are held constant across five rate scenarios (5) reinvestment rate consistent with respective sector.
Knowing what we know now, would we have changed our methodology? No and there’s three reasons why.
Applying a barbell strategy in a flat or inverted yield curve environment makes sense for multiple reasons. First, we don’t know how a flat or inverted curve will revert to a normal, upward-sloping curve. The short end of the curve faces reinvestment risk if rates fall, but the long end of the curve faces interest rate risk if rates rise. A barbell approach hedges against these two risks. This approach also seeks to prioritize the highest yielding and steepest parts of the yield curve, both potential positive drivers of total return. Even though we experienced a shift that benefited the belly of the curve this year, the logic behind a barbell approach remains sound.
Shape Management focuses on maximizing return over a 3-year investment horizon, not a 1-year investment horizon. On a 1-year horizon, price volatility (short-term interest rate moves) may make up the bulk of a fund’s performance, whereas longer time horizons better account for all the drivers of total return, such as income and yield curve roll.
Perhaps most promising for our go-forward investors – the sectors (Corporates, Agency MBS) and yield curve positioning (belly of the curve) that benefitted from a great year in 2025 now look less attractive on a goforward basis. The positioning we held to start the year generally maintains higher all-in yields (through higher rates and wider spreads), compared to where the Category is overweight. If rates continue to fall, there’s more room for some of our longer assets to appreciate. On the other hand, higher yields also make these bonds more attractive in a rates unchanged scenario (greater income), and more defensive if rates rise (better convexity and greater income to offset price erosion).
Despite modest underperformance through November, we remain confident in our current positioning and methodology. We look forward to what can be accomplished in 2026!
Financial professionals only. Not for public distribution.

Adam is a Client Portfolio Manager with 9 years of experience in fixed income markets. He serves as a liaison between the investment, marketing, and sales teams, leading investment strategy updates, portfolio
communications, and market commentary. A previous employee of PTAM’s affiliate company, Performance Trust Capital Partners, Adam specializes in educating investors on complex fixed income asset classes and
strategies through the lens of Shape Management. He holds a BA in Business Economics from Wheaton College.
GLOSSARY
Yield Curve refers to the U.S. Treasury yield curve rates.
RISKS AND OTHER IMPORTANT CONSIDERATIONS
Investing involves risk; principal loss is possible. Investments in debt securities typically decrease in value when interestrates rise. This risk is usually greater for longer-term debt securities. Investments in lower rated and non-rated securities present a greater risk of loss to principaland interest than higher-rated securities. Investments in asset-backed and mortgage-backed securities include risks that investors should be aware of such as credit risk, prepayment risk, possible illiquidity and default, as well as increased susceptibility to adverse economic developments. For a complete list of disclosures, please visit www.ptam.com.
When selecting a bond to invest in, most investors rely on what we refer to as “traditional fixed income metrics,” which are generally a combination of (1) taking a stance on whether interest rates will increase or decrease, (2) yield and (3) duration. Nearly 30 years ago, PTAM’s founders recognized the potential shortcomings in traditional bond metrics, and developed Shape Management, a math-based investment process that addresses each ofthese shortcomings by analyzing the risk return profile of a bond’s future cash flows. Shape Management is a mathematical calculation that analyzesthe risk return profile of a bond’sor group of bonds’ future cash flows. By using Shape Management, PTAM creates projections of the performance of specific bonds or grouping of bonds. These projections are not the actual performance of any bond or product. As a result, Shape Management performance in this email were not actually achieved by any PTAM investment or product. The criteria and assumptions underlying the projected performance may prove to beincorrect. Prospective investors should not rely solely on such projected performance and should conduct a thorough independent analysis of the investment opportunity. The graphs included throughout this email are provided for illustrative and educational purposes only. Projected performance results mayhave many inherent limitations. No representation is being made that an investment will, or is likely to, achieve profits or losses similar tothose shown. In fact, there are frequently significant differences between projected performance results and actual results subsequently achieved. Although projected performance may be useful to consider when making an investment decision. Investment decisions based on Shape Management information may not be profitable. All projected performance is shown as net performance, which includes management fees, reinvestment of interest payments, principal payments, and capital gains.
The information included is not an offer, recommendation or professional advice. Certain information contained herein has been obtained from third party sources and such information has not been independently verified by PT Asset Management, LLC. No representation, warranty, orundertaking, expressed or implied, is given to the accuracy or completeness of such information by PT Asset Management, LLC or any other person. While such sources are believed to be reliable, PT Asset Management, LLC does not assume any responsibility for the accuracy or completeness of such information. PT Asset Management, LLC does not undertake any obligation to update the information contained herein as of any future date. This email is confidential, is intended only for the person to whom it has been directly provided and under no circumstances may a copy be shown, copied, transmitted or otherwise be given to any person other than the authorized recipient without the prior written consent of PT Asset Management, LLC. Any indices and other financial benchmarks shown are provided for illustrative purposes only, are unmanaged, reflect reinvestment of income and dividends and do not reflect the impact of advisory fees. Investors cannot invest directly in an index. Comparisons to indexes have limitations because indexes have volatility and other material characteristicsthat may differ from a particular hedge fund. For example, a hedge fund may typically hold substantially fewer securities than are contained in an index. Certain information contained herein constitutes “forward-looking statements,” which can be identified by the use offorward-looking terminology such as “may,” “will,” “should,” “expect,” “anticipate,” “project,” “estimate,” “intend,” “continue,” or “believe,” or the negatives thereof or other variations thereon or comparable terminology. Due to various risks and uncertainties, actual events, results or actual performance may differ materially from those reflected or contemplated in such forward-looking statements. Nothing contained herein may be relied upon as a guarantee, promise, assurance or a representation as to the future.
© 2025 PT Asset Management,