Money Market Fund assets are at record highs, reaching $8.27 Trillion last week.1 This occurs as the yield on money markets continues to fall. Today, money market yields are nearly 2% lower than their 2023 peak.
Bloomberg MFI US Bills Index
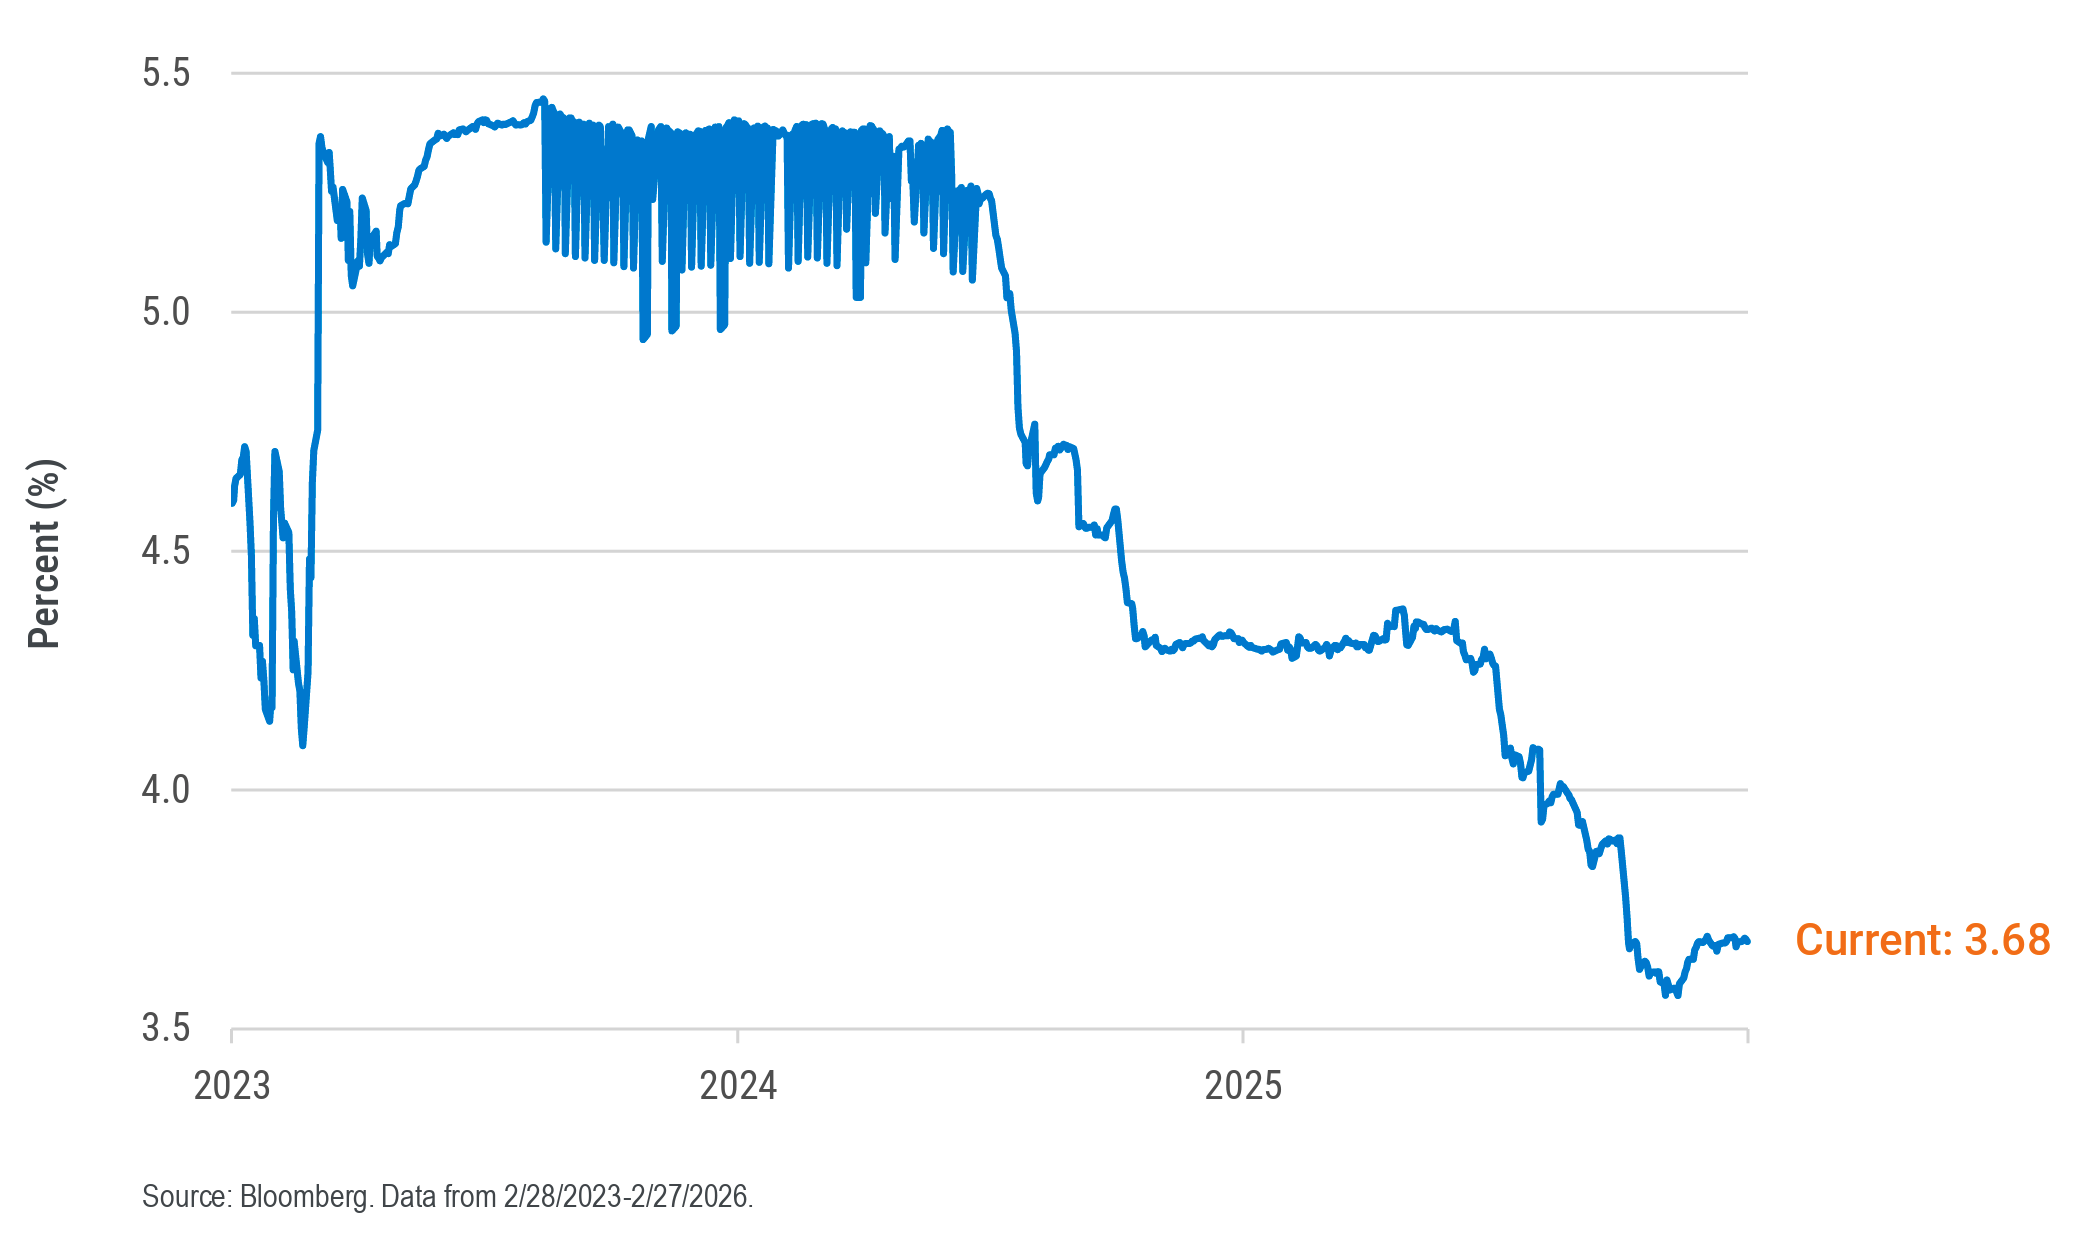
If the return potential on money markets is decreasing, why do money market assets continue to hit new highs? One could likely attribute some of it to inertia or fear and with the amount of headlines circulating around the war in the Middle East, oil prices, private credit, etc. –it’s not hard to assume why investors are sitting on cash. However, the opportunity cost is getting harder to ignore, and there are a few truths we abide by here at PTAM.
- Bonds become more defensive the higher yields climb. Why? Total return is a function of price change and income. With higher starting yields, investors have greater income to offset erosion experienced in price if yields climb higher. This can help investors avoid the stress around attempting to time the peak in interest rates.
-
Combinations reveal opportunities. For those hesitant to move out of cash, it doesn’t need to be an “all or nothing” move. For example, a theoretical portfolio of 100% cash (or money markets) can be transitioned to a portfolio of 50% bonds, 50% money market. This can better support investor return outcomes, regardless of interest rate outcome: interest rates can move up, down, or sideways and still allow for attractive potential returns by combining funds with complementary characteristics.
Total Returns (as of 12/31/2025)
| 1-Year | 5-Year | 10-Year | Since Inception | |
| PTIAX (Inception: 8/31/2010) | 6.92% | 1.08% | 3.19% | 4.53% |
| Bloomberg US Aggregate Bond Index | 7.30% | -0.36% | 2.01% | 2.29% |
| STBF @ NAV (Inception: 4/8/2024) | 6.28% | - | - | 6.27% |
| STBF @ Price (Inception: 4/8/2024) | 6.31% | - | - | 6.35% |
| Bloomberg US Aggregate 1-3 Year Index | 5.39% | - | - | 5.50% |
1- Bloomberg, “Money Funds Rise to Record $8.27 Trillion in Dash for Cash”, March 4, 2026.
Sources: PTAM, Bloomberg, Morningstar Direct, and US Department of the Treasury (www.treasury.gov).

Taylor acts as PTAM’s Client Portfolio Manager, serving as a liaison between investments, marketing, and sales. She is responsible for investment strategy updates and portfolio communications for all PTAM’s products. Taylor additionally leads production of various portfolio and market commentary as well as dedicated strategy content. Taylor received a Bachelor of Arts from the Princeton School of Public and International Affairs from Princeton University. She is also a CFA® charter holder.
GLOSSARY
Yield Curve refers to the U.S. Treasury yield curve rates.
RISKS AND OTHER IMPORTANT CONSIDERATIONS
Investing involves risk; principal loss is possible. Investments in debt securities typically decrease in value when interestrates rise. This risk is usually greater for longer-term debt securities. Investments in lower rated and non-rated securities present a greater risk of loss to principaland interest than higher-rated securities. Investments in asset-backed and mortgage-backed securities include risks that investors should be aware of such as credit risk, prepayment risk, possible illiquidity and default, as well as increased susceptibility to adverse economic developments. For a complete list of disclosures, please visit www.ptam.com.
When selecting a bond to invest in, most investors rely on what we refer to as “traditional fixed income metrics,” which are generally a combination of (1) taking a stance on whether interest rates will increase or decrease, (2) yield and (3) duration. Nearly 30 years ago, PTAM’s founders recognized the potential shortcomings in traditional bond metrics, and developed Shape Management, a math-based investment process that addresses each ofthese shortcomings by analyzing the risk return profile of a bond’s future cash flows. Shape Management is a mathematical calculation that analyzesthe risk return profile of a bond’sor group of bonds’ future cash flows. By using Shape Management, PTAM creates projections of the performance of specific bonds or grouping of bonds. These projections are not the actual performance of any bond or product. As a result, Shape Management performance in this email were not actually achieved by any PTAM investment or product. The criteria and assumptions underlying the projected performance may prove to beincorrect. Prospective investors should not rely solely on such projected performance and should conduct a thorough independent analysis of the investment opportunity. The graphs included throughout this email are provided for illustrative and educational purposes only. Projected performance results mayhave many inherent limitations. No representation is being made that an investment will, or is likely to, achieve profits or losses similar tothose shown. In fact, there are frequently significant differences between projected performance results and actual results subsequently achieved. Although projected performance may be useful to consider when making an investment decision. Investment decisions based on Shape Management information may not be profitable. All projected performance is shown as net performance, which includes management fees, reinvestment of interest payments, principal payments, and capital gains.
The information included is not an offer, recommendation or professional advice. Certain information contained herein has been obtained from third party sources and such information has not been independently verified by PT Asset Management, LLC. No representation, warranty, orundertaking, expressed or implied, is given to the accuracy or completeness of such information by PT Asset Management, LLC or any other person. While such sources are believed to be reliable, PT Asset Management, LLC does not assume any responsibility for the accuracy or completeness of such information. PT Asset Management, LLC does not undertake any obligation to update the information contained herein as of any future date. This email is confidential, is intended only for the person to whom it has been directly provided and under no circumstances may a copy be shown, copied, transmitted or otherwise be given to any person other than the authorized recipient without the prior written consent of PT Asset Management, LLC. Any indices and other financial benchmarks shown are provided for illustrative purposes only, are unmanaged, reflect reinvestment of income and dividends and do not reflect the impact of advisory fees. Investors cannot invest directly in an index. Comparisons to indexes have limitations because indexes have volatility and other material characteristicsthat may differ from a particular hedge fund. For example, a hedge fund may typically hold substantially fewer securities than are contained in an index. Certain information contained herein constitutes “forward-looking statements,” which can be identified by the use offorward-looking terminology such as “may,” “will,” “should,” “expect,” “anticipate,” “project,” “estimate,” “intend,” “continue,” or “believe,” or the negatives thereof or other variations thereon or comparable terminology. Due to various risks and uncertainties, actual events, results or actual performance may differ materially from those reflected or contemplated in such forward-looking statements. Nothing contained herein may be relied upon as a guarantee, promise, assurance or a representation as to the future.
© 2026 PT Asset Management,