Shape of the Markets-November 2025
The Great Cash Carve-Out: Making Room for Bonds This Thanksgiving
November, 2025
Cash parked in money-market funds is now at record levels, with an estimated $7.5 trillion in money markets.1
It’s not hard to fathom why investors may be parked in cash, whether it be fear, or inertia.
The S&P 500 is now up 37% from the “Liberation Day” lows in April. Some investors question whether the equity run is warranted, or if the pace of equity returns is overdone. Fears of an AI bubble grow as the Magnificent 7 has posted 25.4% returns year-to-date, while the S&P 500 Equal Weighted Index has only returned 8.8%. Meanwhile, gold has returned 53% year-to-date, and we’ve had one of the best housing markets in history over the last five years. On the contrary, bonds –as measured by the Bloomberg U.S. Aggregate Index –are still in their longest drawdown in history, at 58 months and counting.
Year-to-date Cumulative Total Returns
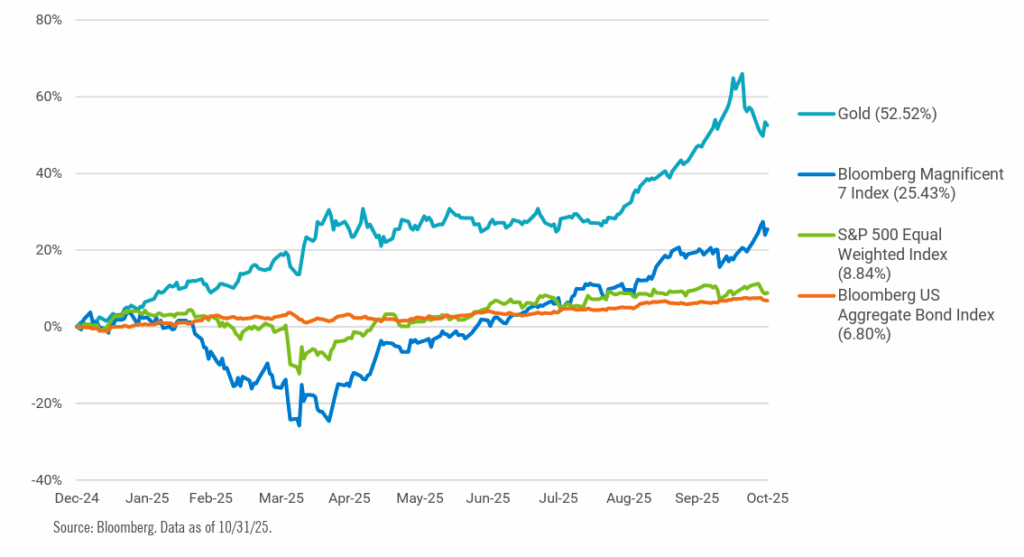
Despite numerous headlines and headwinds for U.S. fixed income – tariffs, inflation, a ballooning fiscal deficit, and government dysfunction – investors still continued to seek fixed income assets. The Bloomberg U.S. Aggregate is up 6.8% year-to-date, a solid year for bonds, yet they maintain go-forward potential. How can that be?
There are a couple ways to consider the opportunity in fixed income.
Source: 30-Year Treasury: www.treasury.gov as of 9/26/2025. Past Performance does not guarantee future results.
There are a couple ways to consider the opportunity in fixed income.
The long end of the Treasury curve (as measured by the 20-year spot, our preferred tenor) has stayed at or near the highest yields witnessed since 2008. Put differently, investors are being compensated at or near the most they have for taking on interest rate risk over the last 17 years. This is a good thing.
The opportunity set is potentially more attractive when considering Tax-Exempt Municipal bonds. For investors in the highest tax bracket, for example, the taxable equivalent yield at the 20-year spot on the AAA MMD, the benchmark municipal curve, is roughly 6.5%. For context, the annualized return on the S&P 500 for the last 25 years is 6.5%.
Money market funds certainly had their place in a portfolio, particularly in 2022 – the worst year for fixed income in history. However, 2022 is precisely why the go-forward potential in fixed income looks more attractive today. Rising yields come at the expense of existing bondholders, but to the benefit of future bondholders. Even though yields have come down this year, the yield-to-worst on the Bloomberg U.S. Treasury Index is still 118 basis points above its 25-year average.
Today, as the front-end of the yield curve comes down, the yield on money market funds is also dropping, making the go-forward carry less appealing. Perhaps most importantly, sitting in cash has come with a cost as rates fell across the entire Treasury curve this year.
Bonds won’t come without the aforementioned headlines and headwinds. Nevertheless, we believe bonds may present themselves as an opportunity worth considering today. In fact, we believe the go-forward returns in bonds may be more than just worthy of consideration – they may actually prove to be quite favorable for those who are willing to embrace their potential.


Taylor Huffman, CFA®
Taylor acts as PTAM’s Client Portfolio Manager, serving as a liaison between investments, marketing, and sales. She is responsible for investment strategy updates and portfolio communications for all PTAM’s products. Taylor additionally leads production of various portfolio and market commentary as well as dedicated strategy
content.
Taylor received a Bachelor of Arts from the Princeton School of Public and International Affairs from Princeton University. She is also a CFA® charter holder.
Sources: PTAM, Bloomberg, MMD AAA FRED, Monkey Market Funds; Total Financial Assets, Level (MMMFFAQ027S). Data as of 10/31/2025 unless otherwise noted.
1-Source: FRED, Monkey Market Funds; Total Financial Assets, Level (MMMFFAQ027S). 10/1/1945-4/1/2015.
Glossary
Yield-to-worst is the lowest potential yield an investor can receive on a bond without the issuer defaulting. It
considers all possible call dates and other features that could affect the bond’s return.
GLOSSARY
Yield Curve refers to the U.S. Treasury yield curve rates.
RISKS AND OTHER IMPORTANT CONSIDERATIONS
Investing involves risk; principal loss is possible. Investments in debt securities typically decrease in value when interestrates rise. This risk is usually greater for longer-term debt securities. Investments in lower rated and non-rated securities present a greater risk of loss to principaland interest than higher-rated securities. Investments in asset-backed and mortgage-backed securities include risks that investors should be aware of such as credit risk, prepayment risk, possible illiquidity and default, as well as increased susceptibility to adverse economic developments. For a complete list of disclosures, please visit www.ptam.com.
When selecting a bond to invest in, most investors rely on what we refer to as “traditional fixed income metrics,” which are generally a combination of (1) taking a stance on whether interest rates will increase or decrease, (2) yield and (3) duration. Nearly 30 years ago, PTAM’s founders recognized the potential shortcomings in traditional bond metrics, and developed Shape Management, a math-based investment process that addresses each ofthese shortcomings by analyzing the risk return profile of a bond’s future cash flows. Shape Management is a mathematical calculation that analyzesthe risk return profile of a bond’sor group of bonds’ future cash flows. By using Shape Management, PTAM creates projections of the performance of specific bonds or grouping of bonds. These projections are not the actual performance of any bond or product. As a result, Shape Management performance in this email were not actually achieved by any PTAM investment or product. The criteria and assumptions underlying the projected performance may prove to beincorrect. Prospective investors should not rely solely on such projected performance and should conduct a thorough independent analysis of the investment opportunity. The graphs included throughout this email are provided for illustrative and educational purposes only. Projected performance results mayhave many inherent limitations. No representation is being made that an investment will, or is likely to, achieve profits or losses similar tothose shown. In fact, there are frequently significant differences between projected performance results and actual results subsequently achieved. Although projected performance may be useful to consider when making an investment decision. Investment decisions based on Shape Management information may not be profitable. All projected performance is shown as net performance, which includes management fees, reinvestment of interest payments, principal payments, and capital gains.
The information included is not an offer, recommendation or professional advice. Certain information contained herein has been obtained from third party sources and such information has not been independently verified by PT Asset Management, LLC. No representation, warranty, orundertaking, expressed or implied, is given to the accuracy or completeness of such information by PT Asset Management, LLC or any other person. While such sources are believed to be reliable, PT Asset Management, LLC does not assume any responsibility for the accuracy or completeness of such information. PT Asset Management, LLC does not undertake any obligation to update the information contained herein as of any future date. This email is confidential, is intended only for the person to whom it has been directly provided and under no circumstances may a copy be shown, copied, transmitted or otherwise be given to any person other than the authorized recipient without the prior written consent of PT Asset Management, LLC. Any indices and other financial benchmarks shown are provided for illustrative purposes only, are unmanaged, reflect reinvestment of income and dividends and do not reflect the impact of advisory fees. Investors cannot invest directly in an index. Comparisons to indexes have limitations because indexes have volatility and other material characteristicsthat may differ from a particular hedge fund. For example, a hedge fund may typically hold substantially fewer securities than are contained in an index. Certain information contained herein constitutes “forward-looking statements,” which can be identified by the use offorward-looking terminology such as “may,” “will,” “should,” “expect,” “anticipate,” “project,” “estimate,” “intend,” “continue,” or “believe,” or the negatives thereof or other variations thereon or comparable terminology. Due to various risks and uncertainties, actual events, results or actual performance may differ materially from those reflected or contemplated in such forward-looking statements. Nothing contained herein may be relied upon as a guarantee, promise, assurance or a representation as to the future.
© 2025 PT Asset Management,