We had the pleasure of welcoming a handful of clients and advisors to Chicago last month for our “Bond University,” where we provide a deep-dive analysis into Shape Management and why we invest the way we do. We start our time together by diving into the fundamental flaws in traditional metrics, which we believe do a poor job of illustrating a bond’s risk-adjusted return potential. Instead, we rely on the mathematical nature of fixed income to analyze how a bond will perform in various interest rate environments over time – and how this way of investing can lead to potentially superior outcomes for our clients.
There was a deal last month in Municipal land that can illustrate the benefits of Shape Management and the shortcomings of traditional metrics. It was a Water Revenue Bond by the City of San Antonio, with maturities ranging from 2027-2048.
Here are just four of them:
Three-year horizon total return analysis (Illustrative performance)
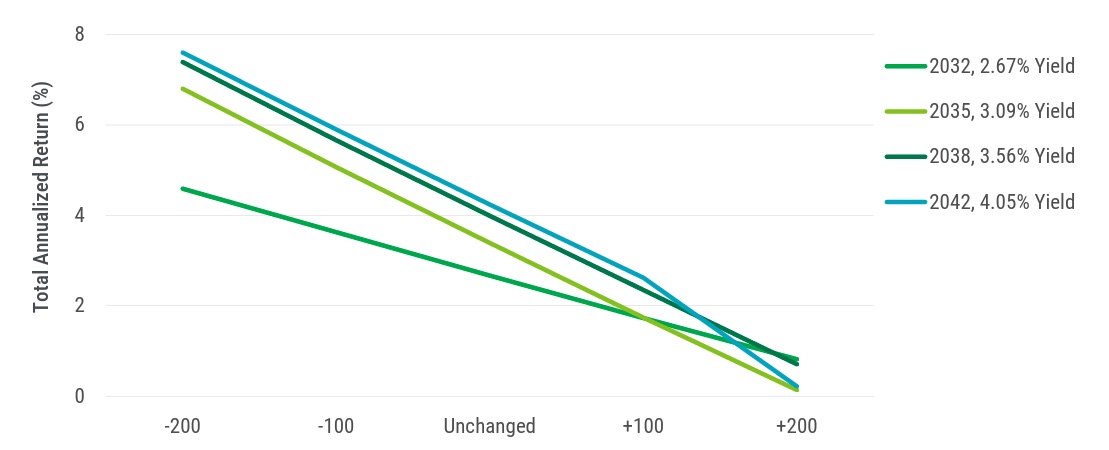
Change in Interest Rates (Basis Points)
Sources: PTAM, Bloomberg as of 9/23/2025. None of the following bonds that are used to create the Shapes are held by PTAM clients as of the date of this distribution: City of San Antonio 2032 (2.67% Yield), 2035 (3.09% Yield), 2038 (3.56% Yield), and 2042 (4.05% Yield). These shapes were generated with just 1 bond. Assumptions: (1) a parallel shift in the yield curve (2) static allocation for 3 years (3) linear rate changes (4) sector specific spreads are held constant across five rate scenarios (5) reinvestment rate consistent with respective sector. Financial professionals only. Not for public distribution.
As portfolio managers, we make investment decisions among thousands of CUSIPs. But as we see in this example, even just four bonds can feel noisy!
Let’s reduce our comparisons to two bonds at a time:
Three-year horizon total return analysis (Illustrative performance)
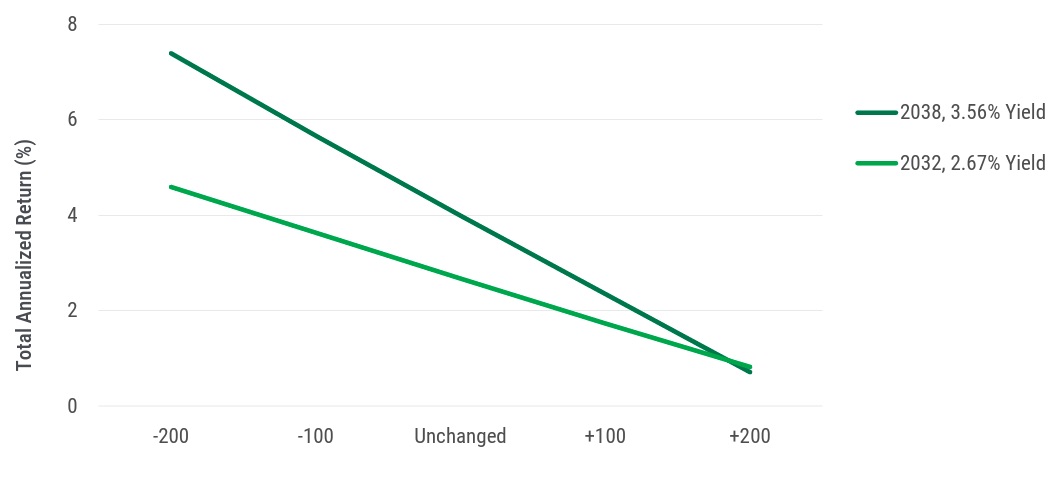
Change in Interest Rates (Basis Points)
Sources: PTAM, Bloomberg as of 9/23/2025. None of the following bonds that are used to create the Shapes are held by PTAM clients as of the date of this distribution: City of San Antonio 2032 (2.67% Yield), and 2038 (3.56% Yield). These shapes were generated with just 1 bond. Assumptions: (1) a parallel shift in the yield curve (2) static allocation for 3 years (3) linear rate changes (4) sector specific spreads are held constant across five rate scenarios (5) reinvestment rate consistent with respective sector. The 2032 bond is a clear “dog” to the 2038 bond, as it underperforms the 2038 bond in most interest rate scenarios. Nevertheless, the 2032 had HIGHER investor interest than the 2038 as measured by subscription levels
Here are the other two bonds for consideration:
Three-year horizon total return analysis (Illustrative performance)
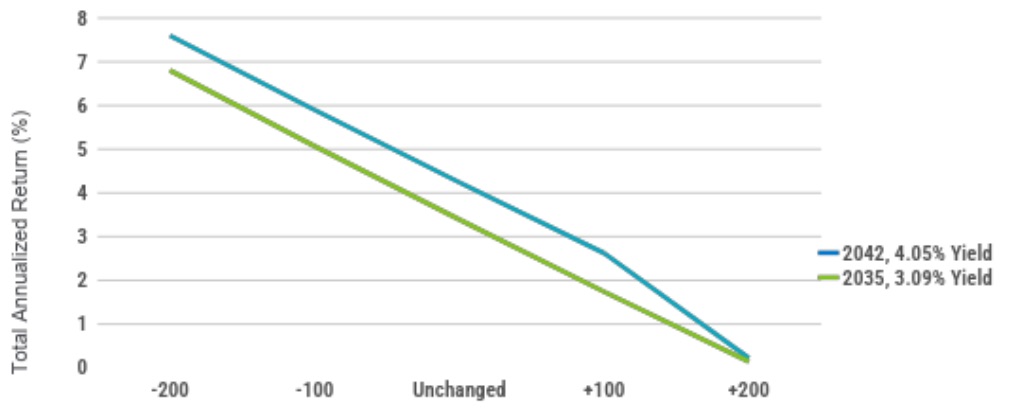
Change in Interest Rates (Basis Points)
Sources: PTAM, Bloomberg as of 9/23/2025. None of the following bonds that are used to create the Shapes are held by PTAM clients as of the date of this distribution: City of San Antonio 2035 (3.09% Yield) and 2042 (4.05% Yield). These shapes were generated with just 1 bond. Assumptions: (1) a parallel shift in the yield curve (2) static allocation for 3 years (3) linear rate changes (4) sector specific spreads are held constant across five rate scenarios (5) reinvestment rate consistent with respective sector.
The 2035 bond was the MOST LOVED bond in the deal, with one of the highest subscription levels – more than 8 times oversubscribed! Through the lens of Shape Management, it’s a no-brainer dog when compared to the 2042 bond … which had subscription levels of 1.72x. While we did not participate in this deal, it is evident that Shape Management provided more clarity to the decision-making process. Investors would have been better off using Shape Management than the traditional framework of fixed income investing! We will continue to offer our “Bond University” event around the country throughout 2026. During our time together, you’ll learn why traditional metrics, like yield and duration, fail in their efforts to measure return and risk. More importantly, you’ll learn how to apply Shape Management and witness why we believe it is a better way of investing. Keep an eye out for our schedule of events in 2026!

Taylor acts as PTAM’s Client Portfolio Manager, serving as a liaison between investments, marketing, and sales. She is responsible for investment strategy updates and portfolio communications for all three mutual funds. Taylor additionally leads production of various
portfolio and market commentary as well as dedicated strategy content. Taylor worked in mutual fund distribution at PTAM before being promoted to Client Portfolio Manager. Prior to PTAM, Taylor was a Multi-Asset Trader at LGIM (Legal & General Investment) America, where
she traded equities, sovereign fixed income, derivatives, and foreign exchange. Taylor received a Bachelor of Arts from the Princeton School of Public and International Affairs from Princeton University.
She is also a CFA® charter holder.
Glossary:
Yield Curve refers to the U.S. Treasury yield curve rates.
Risks and Other Important Considerations
Investing involves risk; principal loss is possible. Investments in debt securities typically decrease in value when interest rates rise. This risk is usually greater for longer-term debt securities. Investments in lower rated and non-rated securities present a greater risk of loss to principal and interest than higher-rated securities. Investments in asset-backed and mortgage-backed securities include risks that investors should be aware of such as credit risk, prepayment risk, possible illiquidity and default, as well as increased susceptibility to adverse economic developments. For a complete list of disclosures, please visit www.ptam.com.
When selecting a bond to invest in, most investors rely on what we refer to as “traditional fixed income metrics,” which are generally a combination of (1) taking a stance on whether interest rates will increase or decrease, (2) yield and (3) duration. Nearly 30 years ago, PTAM’s founders recognized the potential shortcomings in traditional bond metrics, and developed Shape Management, a math-based investment process that addresses each of these shortcomings by analyzing the risk return profile of a bond’s future cash flows. Shape Management is a mathematical calculation that analyzes the risk return profile of a bond’s or group of bonds’ future cash flows. By using Shape Management, PTAM creates projections of the performance of specific bonds or grouping of bonds. These projections are not the actual performance of any bond or product. As a result, Shape Management performance in this email were not actually achieved by any PTAM investment or product. The criteria and assumptions underlying the projected performance may prove to be incorrect. Prospective investors should not rely solely on such projected performance and should conduct a thorough independent analysis of the investment opportunity. The graphs included throughout this email are provided for illustrative and educational purposes only. Projected performance results may have many inherent limitations. No representation is being made that an investment will, or is likely to, achieve profits or losses similar to those shown. In fact, there are frequently significant differences between projected performance results and actual results subsequently achieved. Although projected performance may be useful to consider when making an investment decision. Investment decisions based on Shape Management information may not be profitable. All projected performance is shown as net performance, which includes management fees, reinvestment of interest payments, principal payments, and capital gains.
The information included is not an offer, recommendation or professional advice. Certain information contained herein has been obtained from third party sources and such information has not been independently verified by PT Asset Management, LLC. No representation, warranty, or undertaking, expressed or implied, is given to the accuracy or completeness of such information by PT Asset Management, LLC or any other person. While such sources are believed to be reliable, PT Asset Management, LLC does not assume any responsibility for the accuracy or completeness of such information. PT Asset Management, LLC does not undertake any obligation to update the information contained herein as of any future date. This email is confidential, is intended only for the person to whom it has been directly provided and under no circumstances may a copy be shown, copied, transmitted or otherwise be given to any person other than the authorized recipient without the prior written consent of PT Asset Management, LLC. Any indices and other financial benchmarks shown are provided for illustrative purposes only, are unmanaged, reflect reinvestment of income and dividends and do not reflect the impact of advisory fees. Investors cannot invest directly in an index. Comparisons to indexes have limitations because indexes have volatility and other material characteristics that may differ from a particular hedge fund. For example, a hedge fund may typically hold substantially fewer securities than are contained in an index. Certain information contained herein constitutes “forwardlooking statements,” which can be identified by the use of forward-looking terminology such as “may,” “will,” “should,” “expect,” “anticipate,” “project,” “estimate,” “intend,” “continue,” or “believe,” or the negatives thereof or other variations thereon or comparable terminology. Due to various risks and uncertainties, actual events, results or actual performance may differ materially from those reflected or contemplated in such forward-looking statements. Nothing contained herein may be relied upon as a guarantee, promise, assurance or a representation as to the future.
CFA® and Chartered Financial Analyst® are registered trademarks owned by CFA Institute.
© 2025 PT Asset Management, LLC. All Rights Reserved. PT Asset Management, LLC (“PTAM”) is the advisor to the PTAM Funds. Distributed by ALPS Distributors, Inc.