Muni Prism
June, 2026
Exploring Without Deploying: Public Power and Data Center Demand
A New Source of Load: Data Centers
Data centers are not a new concept, but their current scale and increasing adoption of Artificial Intelligence (AI) may be redefining their role as customers and how they fit within the public power universe. We expect them to remain top of mind for municipal electric utility operators and bond investors alike. The rapid growth and concentration of data center load, along with the resulting political debate at the state and local level, will shape how public power systems and their ratepayer bases are affected. The risk to utilities would come from high fixed costs should capacity be overbuilt (data center load may require the host utility to multiply its existing generation capacity) without contractual provisions to protect against load losses or early contract termination. Primary market supply totaled 8,155 megawatts (MW) in the first half of 2025, up 43.4% year-over-year underscoring continued end-user demand, particularly from hyperscalers.1
Capital expenditure (CapEx) driving demand for generation Capital spending by the “Big Four” hyperscalers (Meta, Alphabet, Amazon, and Microsoft) is driving the need for electric generation to meet existing and future computing capacity. It is expected that hyperscale capital spending will reach $700 bn in 2026, about 6.0x 2022 spending, and expected to grow by 17.0% in 2027.2
Technology driving electricity consumption Data centers have sizeable electricity requirements and are projected to increase with the advancements being made in AI model training. Two key components in data centers that are driving this thirst for energy include servers (equipped with high performance Central Processing Units (CPUs), Graphics Processing Units (GPUs) and custom-designed chips built for specific tasks), and cooling equipment which account for approximately 75.0% and 7.0% of consumed electricity, respectively.3
Power sector realignment From 2008 to 2020, efficiency standards and the shift to a less-intensive services focused economy tempered electric demand growth from a growing population and expanding economy.
Average electricity consumption grew by 0.32% annually for the period 2005-2020 but rose on average by 1.78% annually for the period 2021-2024. The Energy Information Administration (EIA) projects electricity usage to grow by 1.23% and 3.31% in 2026 and 2027, respectively.4
Chart 1: Electricity Sales and Growth
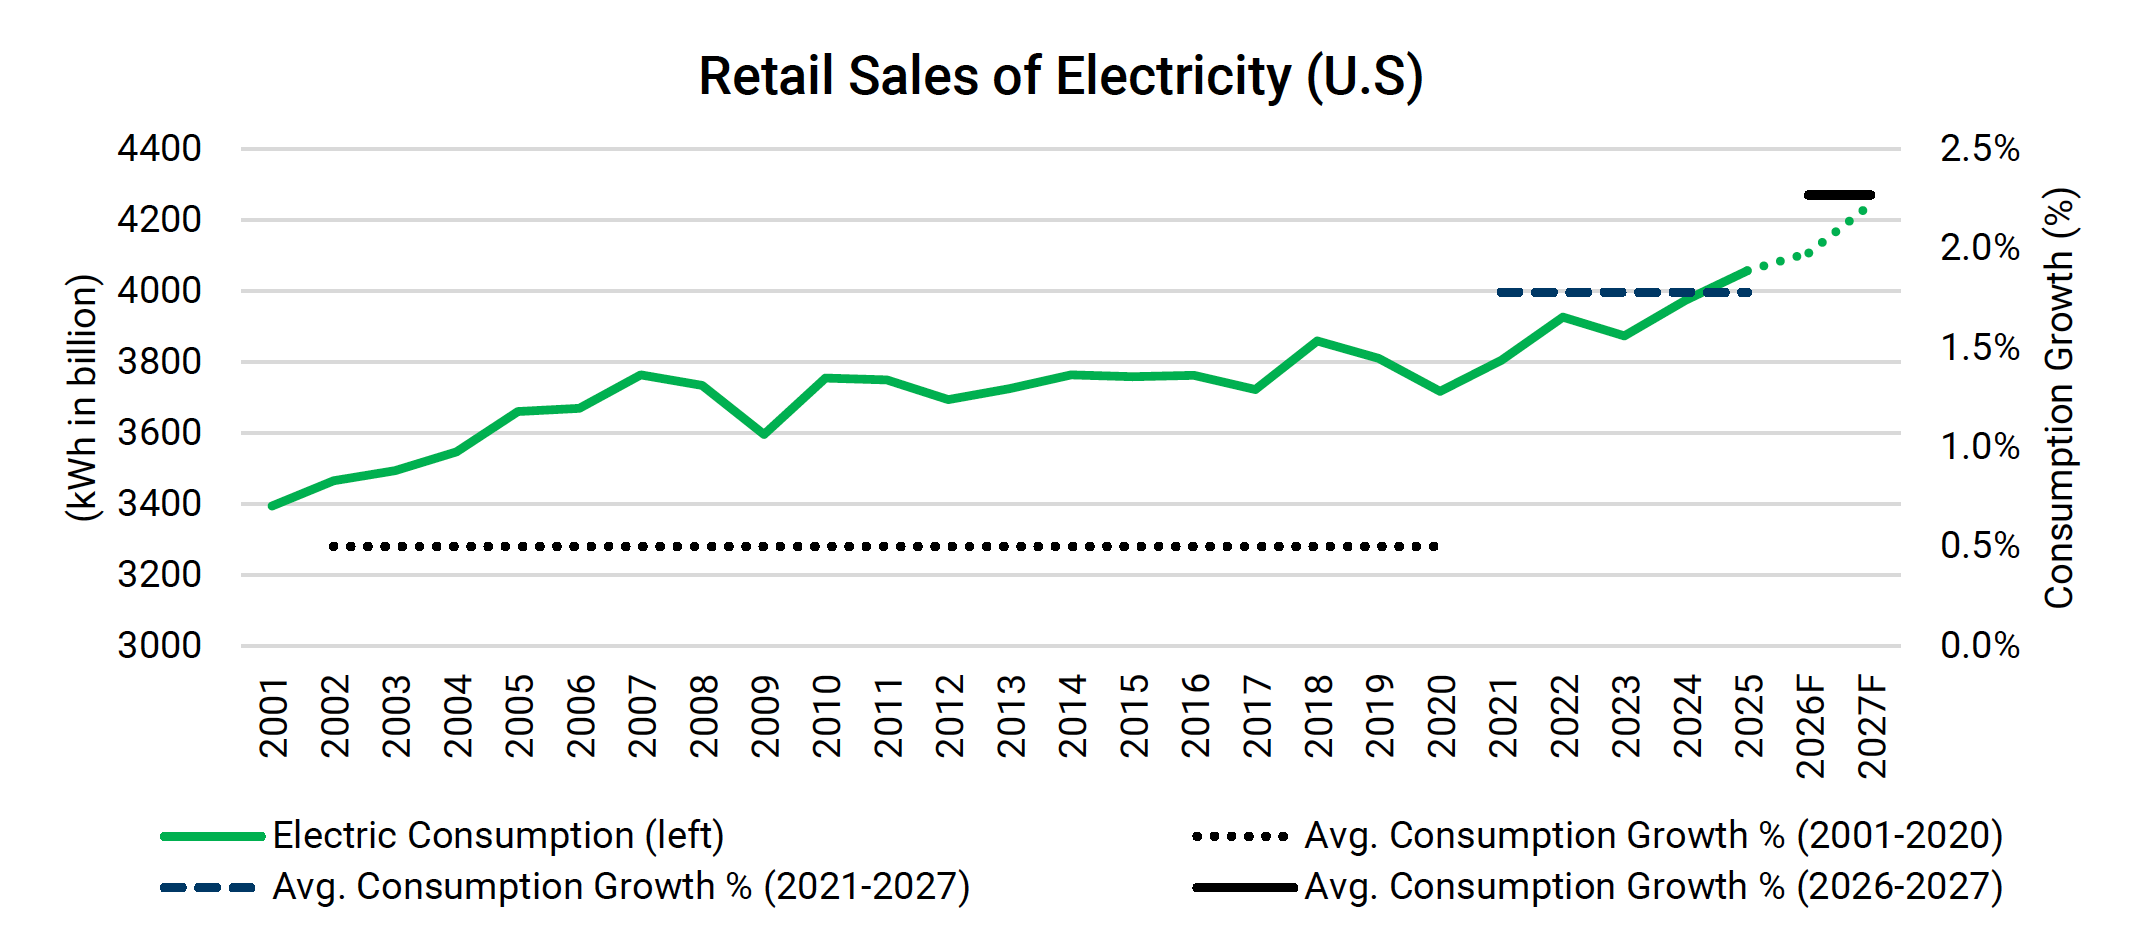
Sources: PTAM, Energy Information Administration (EIA).
Note: Sales to ultimate customers include residential, commercial, industrial and transportation. Does not include direct use of onsite generation
De-coupling of consumption and revenue Electric utilities were not generating incremental revenue because of the stagnant demand for electricity and therefore rates started to rise. The combination of Environment Protection Agency (EPA) emissions standards equipment retrofitting, legacy unit replacement, and inflation have continued to drive the fixed costs higher with the average retail price reaching 13.63 cents/ kWh in 2025, from 9.83 cents in 2010.5That would equate to $1,375/ year (899 kWh usage/ mo.) or 1.64% of median household income (2024), still considered affordable at the median. This affordability metric underpins financial flexibility should utilities need it.
Findings
The rapid expansion of AI load, mostly met with investor-owned utility generation because they have the capacity to respond more quickly to hyperscaler needs, is forcing municipal utilities to reconsider their resource planning. Public power systems are inherently more cautious and navigating the AI data center boom more carefully because their overarching mission is to provide a public good that is affordable and reliable.
To gauge the importance of data center load and utility engagement across the sector, using disclosure as a proxy, we analyzed 52 issuers with public disclosure6—representing over $100 billion of combined par outstanding across 24 states and system types (vertically integrated retail systems, joint action agencies, and cooperatives).
Approximately 54% of the utilities reviewed (28 of 52) included at least one reference to data centers in public disclosures, though mentions are unevenly distributed across credits and disclosure types. References are most frequently observed in official statements, with more limited inclusion in audits and risk factor sections, suggesting that data centers are not yet consistently framed as a core credit consideration.
Where disclosed, commentary is generally limited in detail but clusters around a consistent set of themes: load growth within service territories, inquiries from data center developers, and, less frequently, active development or construction activity. This pattern indicates that while data centers are increasingly entering the disclosure narrative, engagement remains preliminary and largely exploratory rather than fully embedded in utility planning at this time.
Chart 2: Data Center Mention Breakdown
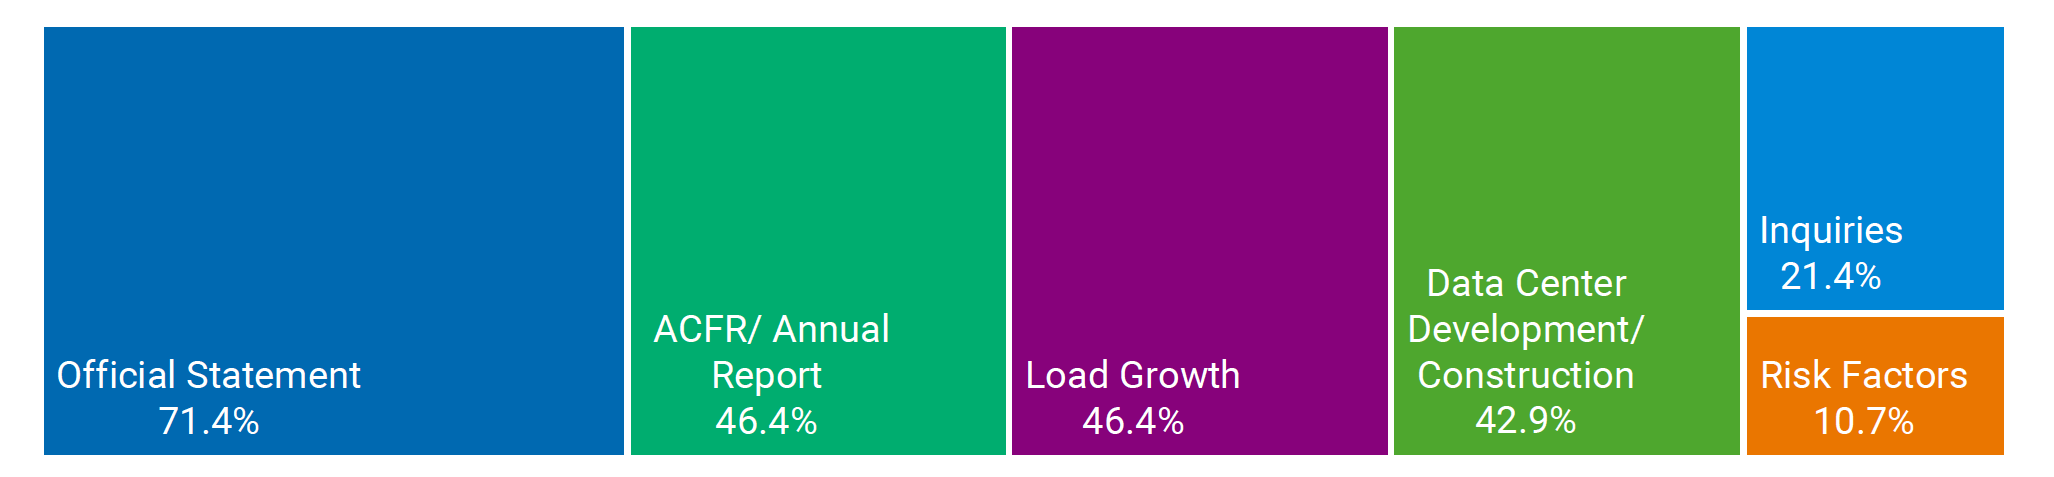
Sources: PTAM, Issuers (ACFR, Annual Reports, Budgets and Official Statements).
Note: Percentages do not equal 100% because a utility may have multiple references across “mention” categories
Building to Serve Versus Serving from Excess Capacity
Data center sizeable load AI is a rapidly evolving space and while capitalizing on the opportunity to serve additional load, overinvesting to meet “speculative load” could leave a utility with stranded assets and associated fixed costs over a long period of time. Hyperscale data centers are large relative to a median utility’s peak demand. It is estimated that data center electricity demand would double in 2026 and double again by 2030, accounting for 11.7% of total electric consumption, up from 5.2% in 2005.7
Table 1: Data Center Needs Relative to Midsized and Large Utilities
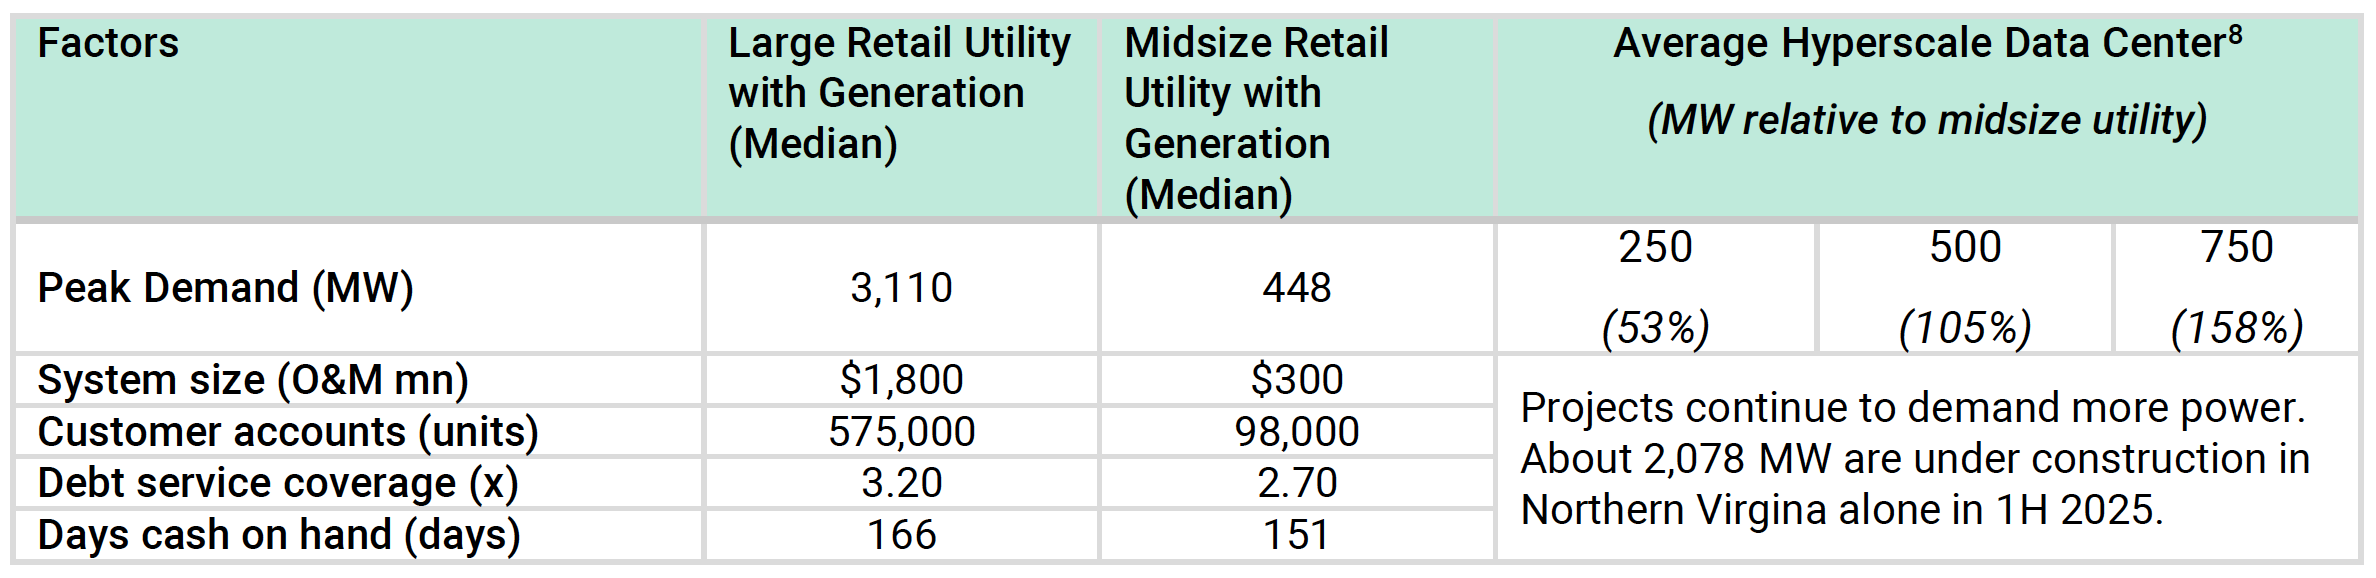
Sources: PTAM, North America Data Center Trends H1 2025, CBRE, September 8, 2025.
Sizeable load requirements introduce risks to public utilities, namely capital spending, liquidity requirements, and cash flow coverage of debt service. The cost of construction together with capitalized interest during construction and at minimum a debt service reserve fund could quickly balloon the size of a bond issuance.
Speculative data center loads The potential impact from hyperscale data center load could differ across utilities because of other considerations including terms for the contracted load, financial strength of credit, and service area fundamentals. Credits at the top of the credit quality stack may be better positioned to absorb speculative load risk, relative to a mid-quality credit.
To demonstrate the hypothetical impact of speculative load on a mid-sized median utility, we assumed that a 250MW gas fired unit would be constructed, and the project would be fully funded with debt proceeds (30 years, level debt service) and debt sizing would include a debt service reserve.
To isolate the financial impact of this speculative load, it is assumed that the plant operates at a lower capacity factor (CF) of 20.0% and a gas price of $3.00. Electric rates are held constant and not assumed to offset the revenues lost from underutilized generation capacity.
Table 2: Speculative Load Assumptions

Source: PTAM, new capacity (EIA, as of July 2025), construction cost (GridLab, as of Sept. 2025), capacity factor & heat rate(EIA, as of Feb. 2024), natural gas price (Bloomberg, as of 05/06/2026).
Note: Data used may be subject to rounding.
Sensitivity: Debt Service Coverage (x) for a Midsized Utility Adding 250MW Gas Generation
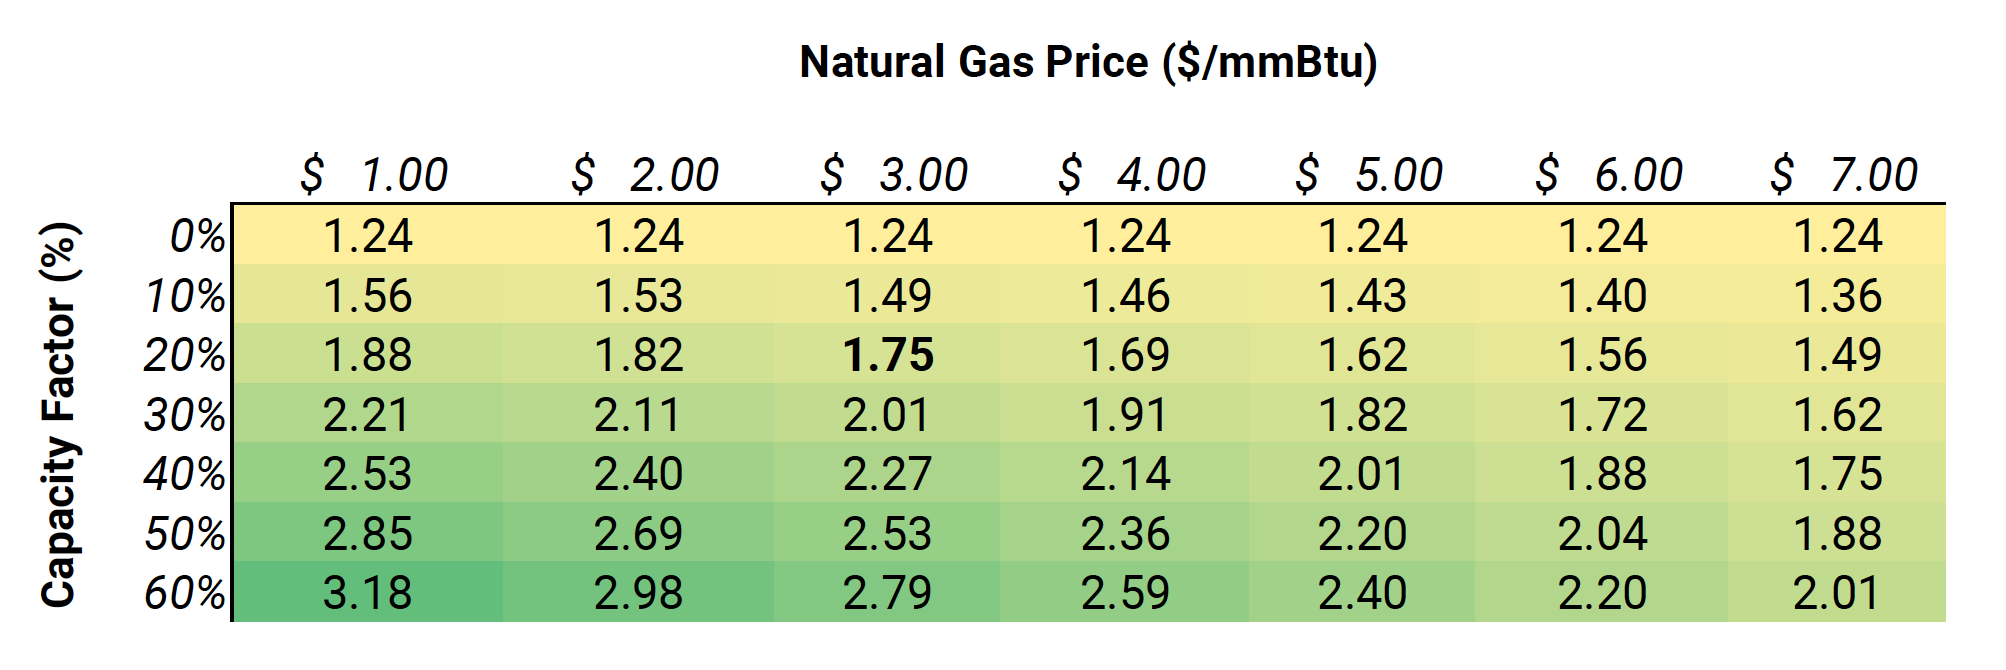
Source: PTAM. Financial and operating data for a mid-sized utility as of Fiscal Year 2024.
Fuel costs account for a meaningful portion of operating costs, and the capacity factor (unit actual energy output relative to its full potential) impacts profitability. Generally, a plant’s economics improve as fuel is cheaper and as capacity factor is higher.
In this scenario, the addition of a 250MW gas-fired plant could reduce debt service coverage (DSC) for a mid-sized utility to 1.75x from about 3.10x pre-capacity expansion. This is a conservative estimate and does not account for savings from reducing existing purchased power, electric rate increases, equity funding, contractor skillset, and regional construction costs. The alternative is to serve new load from existing excess capacity which would not require the upfront and sizeable capital needs, and eliminate construction and ramp-up risk, and may ultimately boost cash flow from operations.
Convergence of pressure With the electrification of the U.S. economy, legacy plant retirements and capacity replacement, maintenance of aging infrastructure, climate hardening of assets, internet of things, and persistent inflation, there is financial pressure on utilities without even incorporating the urgent and sizeable demand for electricity from data centers.
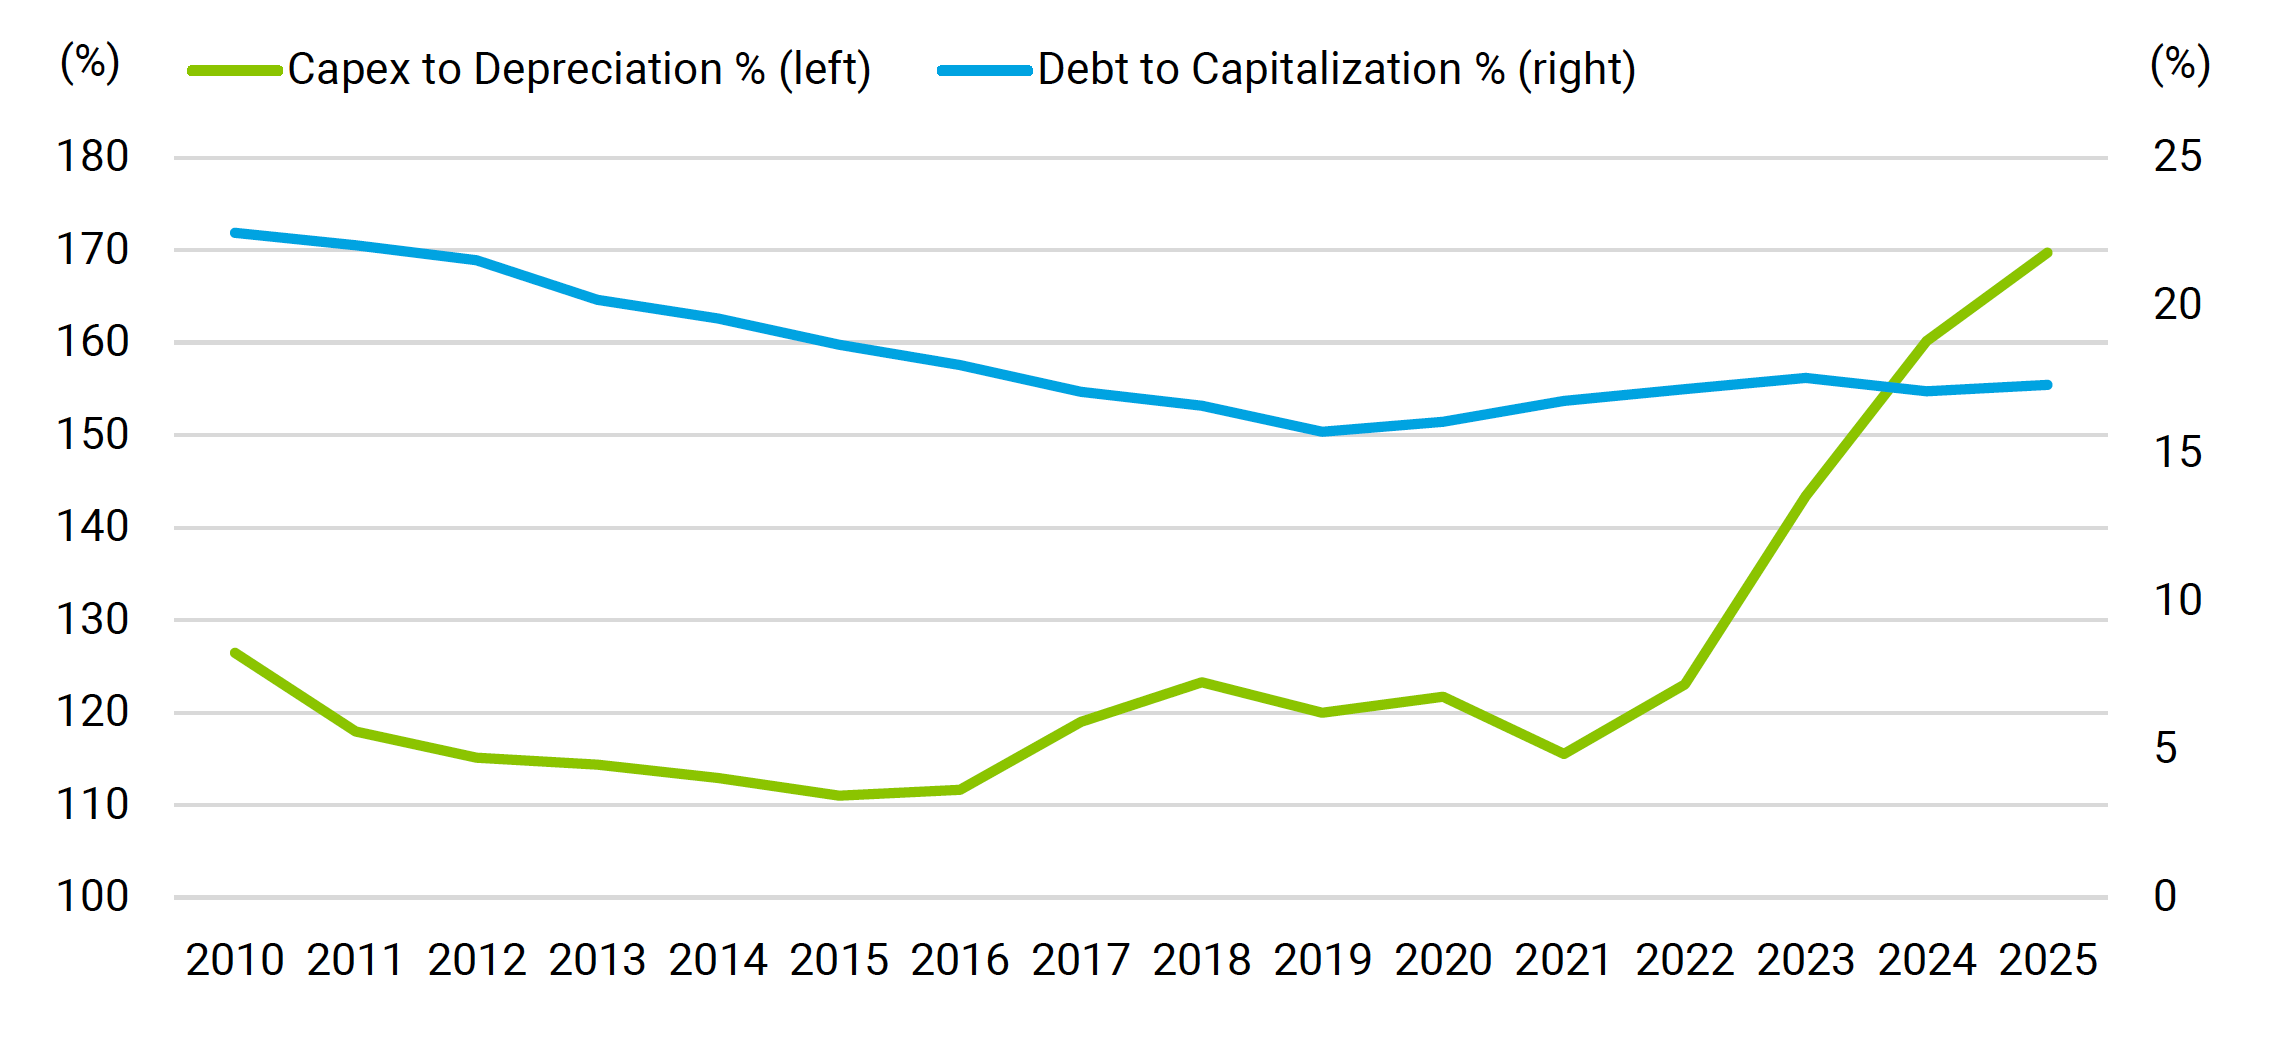
Chart 3: Retail Electric Capital Spending
Source: PTAM. Financial and operating data for a mid-sized utility as of Fiscal Year 2024.
Overcoming Complacency –Key Takeaways
- It is too early to conclude how data centers will be integrated more broadly into the public power complex.
- The longer-term resource planning mandate of public power systems is a mismatch for the rapid scaling of data centers, and therefore sufficient provisions to protect against reduced offtake or early contract termination are critical to credit quality.
- Importance of teasing out speculative versus real load.
- Rate affordability for retail customers, and rate-making flexibility is an essential anchor for utility credit.
- Utilities vary in size of operation, payor mix, size of customer base, and financial flexibility. The impact of such load, should a utility undertake it, will vary across credits.
1 North America Data Center Trends H1 2025, CBRE, September 8, 2025.


Glossary
Medicaid Joint federal and state program that provides health coverage to low-income individuals and families, Payor Mix Refers to the breakdown of a hospital’s revenue sources which include Medicare/ Medicaid, commercial insurance and self-pay. Total Fund Balance Net resources available in a state’s governmental funds at the end of a fiscal year (includes general fund and rainy-day fund). Trigger Law Laws in place that would automatically end Medicaid expansion or require changes if the federal match rate were to drop. Not all trigger laws would immediately end the Medicaid expansion. Fixed cost burden Consists of annual recurring fixed costs needed to meet long-term obligations (debt service payments, pension contributions, and retiree health care contributions [OPEB]). Net direct debt means total direct debt minus self-supporting debt. Self-supporting debt is debt with a specific revenue source pledged for its repayment. Total Fund Balance Net resources available in a state’s governmental funds at the end of a fiscal year (includes general fund and rainy-day fund). Total government funds revenue (TGFR) Total governmental revenue is used for calculation of certain metrics as it gives a more comprehensive view of states financial sources and expenditures.
Risks and Other Important Considerations
Not an Offer, Recommendation or Professional Advice: This document does not constitute advice or a recommendation or offer to sell or a solicitation to deal in any security or financial product. It is provided for information purposes only and on the understanding that the recipient has sufficient knowledge and experience to be able to understand and make their own evaluation of the proposals and services described herein, any risks associated therewith and any related legal, tax, accounting or other material considerations. To the extent that the reader has any questions regarding the applicability of any specific issue discussed above to their specific portfolio or situation, prospective investors are encouraged to contact PT Asset Management (PTAM) or consult with the professional advisor of their choosing.
Forward-Looking Statements: Certain information contained herein constitutes “forward-looking statements,” which can be identified by the use of forward-looking terminology such as “may,” “will,” “should,” “expect,” “anticipate,” “project,” “estimate,” “intend,” “continue,” or “believe,” or the negatives thereof or other variations thereon or comparable terminology. Due to various risks and uncertainties, actual events, results or actual performance may differ materially from those reflected or contemplated in such forward-looking statements. Nothing contained herein may be relied upon as a guarantee, promise, assurance or a representation as to the future.
Investing involves risks; principal loss is possible. There is no guarantee that the strategies and services will be successful or outperform other strategies and services. Certain assumptions may have been made in connection with the analysis presented herein, and changes to the assumptions may have a material impact on the analysis or results. The information contained herein has been obtained from sources considered to be reliable, and is subject to change without notice. PT Asset Management, LLC does not guarantee its accuracy, adequacy or completeness and is not responsible for any errors or omissions for the results obtained from the use of such information.
CFA® and Chartered Financial Analyst® are registered trademarks owned by CFA Institute.
PT Asset Management (PTAM) is the advisor to the Performance Trust Funds. Distributed by ALPS Distributors, Inc. © 2025 PT Asset Management, LLC. All Rights Reserved. Investment and Insurance Products: Are not FDIC or any other Government Agency Insured •Are not Bank Guaranteed •May Lose Value.